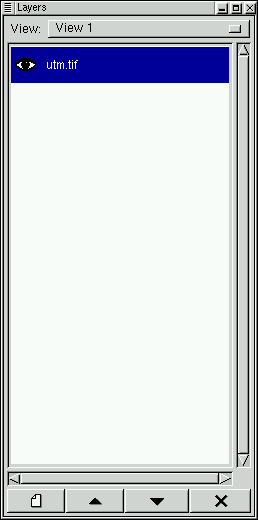


 ) on the main window
icon bar.
) on the main window
icon bar.
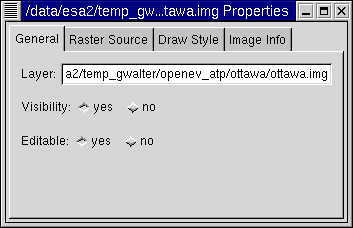
 , then
under the "Draw Style" tab, toggle the "Subpixel Interpolation"
menu between "Off (Nearest)" and "Linear".
, then
under the "Draw Style" tab, toggle the "Subpixel Interpolation"
menu between "Off (Nearest)" and "Linear".
![]()
 icon or press the "Home" key to rescale the raster to its
default display size.
icon or press the "Home" key to rescale the raster to its
default display size.
 to bring up the classification dialog.
 icon to create a legend for it.
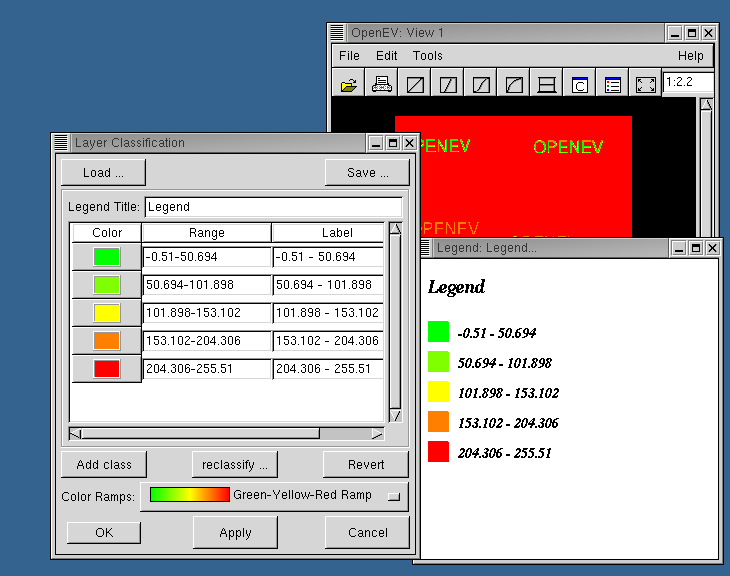
Green-Yellow-Red
0
0.0 (0.0, 1.0, 0.0, 1.0)
0.5 (1.0, 1.0, 0.0, 1.0)
1.0 (1.0, 0.0, 0.0, 1.0)
The first line specifies the name, the second line indicates the type of colour ramp (0 for continuous, 1 for discrete values), and the subsequent lines indicate the colours to vary between, specified as a red-green-blue-alpha grouping, where alpha is the opacity level. You can reset the location of your ramps directory by editing the ".openev" file in your home directory to contain the line (this one sets it to /data/ramps):
ramp_directory=/data/ramps
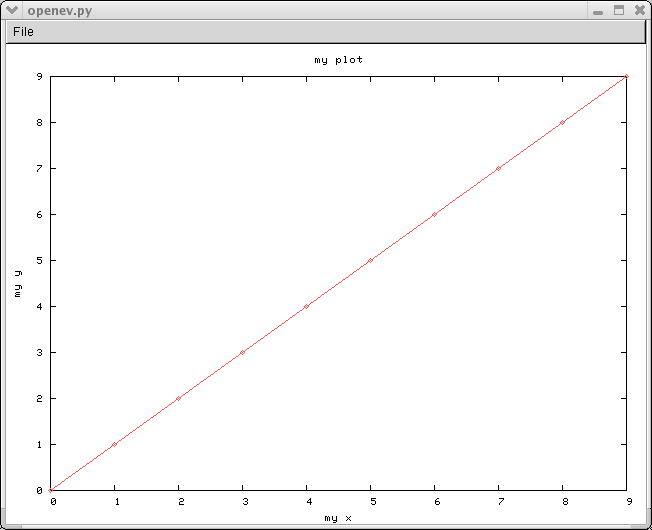
This demonstrates the use of two OpenEV Python shell core commands, get (extract the underlying data from the currently active view/layer into a shell variable- in this case the shell variable will be called "im1"), and show (display an array or GvShapes variable in an OpenEV view). If "get /s im1" is used instead of "get im1", OpenEV will try to grab a screenshot rather than extracting the underlying data (note: with some video card drivers this doesn't work very well):
If you are not using the /s option and want to extract only part of the data, you can specify a "Region of Interest" (ROI) on the OpenEV view using the ROI Tool:
- Activate the ROI tool by selecting the "Edit->Edit Toolbar" menu entry and pressing the "Draw ROI" button.
- Left click and drag out the ROI on your OpenEV view (it should appear as an orange rectangle).
If an ROI is drawn, "get im2" should grab the data that corresponds to the region you selected rather than the whole image. ROI's are ignored if the screenshot (/s) option is used.
Python arrays are indexed from 0:N-1, where N is the length of the array in the dimension being indexed. Slices take the form start:stop:step, where start is the start index, stop is the index of the element after the last element to be included, and step is the step size. If the start, stop, or step indices are left out, they are set to 0,N, and 1 respectively for a dimension of length N. Continuing to operate on im1, try setting "im1[::2,:]=0". This will set every second line to zero:
Numeric Python offers much more array manipulation capability, including matrix addition/subtraction, multiplication/division (both element-wise and regular multiplication), and logical operations. It also overloads common operators such as "+" so that elementwise addition can be accomplished using statements like "im3=im1+im2", where im1 and im2 are same-size arrays. It also has a number of other modules that can be imported to do more sophisticated operations (eg. FFT). Note that if you are not using floating point arrays, some operations may result in overflow errors. These errors can be avoided either by using floating point arrays to start with, or by casting the arrays in the statement, for example: "im3=im1.astype('d')+im2". The type codes in Numeric Python include:
- Character ('c')
- Integer ('1','s','i','l')
- Unsigned Integer ('b','w','u')
- Float ('f','d')
- Complex ('F','D')
The division within each type corresponds to different numbers of bits used to store the type (eg. 8-bit versus 16-bit integer). You can create arrays of any of these types in Numeric Python using the "array", "ones", and "zeros" functions.
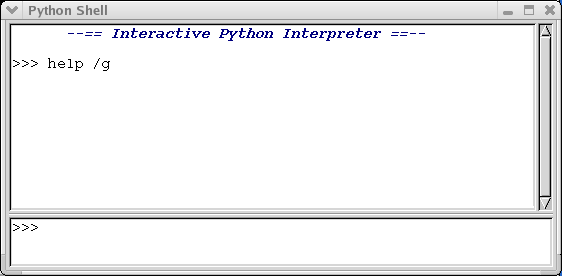
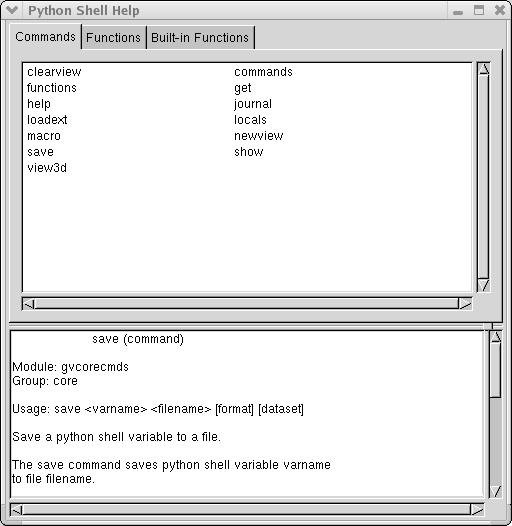
Enter "commands" and "functions" at the command line to see lists of the available OpenEV commands and currently loaded Python functions. "help /g" or "help -g" will display these in graphical format.
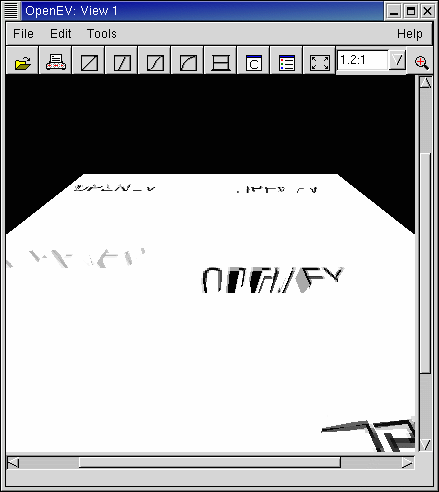
This example demonstrates the limitations of using a regular grid of values to sample a DEM- it doesn't work well on an image that is mostly uniform, but has a few radical changes. It looks okay for many natural scenes, but will have to be updated if urban fly-throughs are to look good in OpenEV. The next image shows the results if the mesh LOD is upped to 8:
This is somewhat better, but much slower to render. Some applications use a triangulated irregular network (TIN) representation of the DEM to get around this problem- this allows higher resolution where it is needed; lower where the scene is uniform. This sort of thing will be a consideration if further development is done on OpenEV's 3D capabilities.
 icon.
icon.
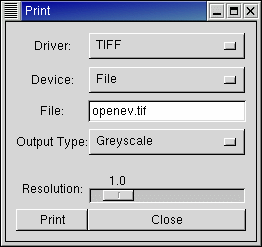
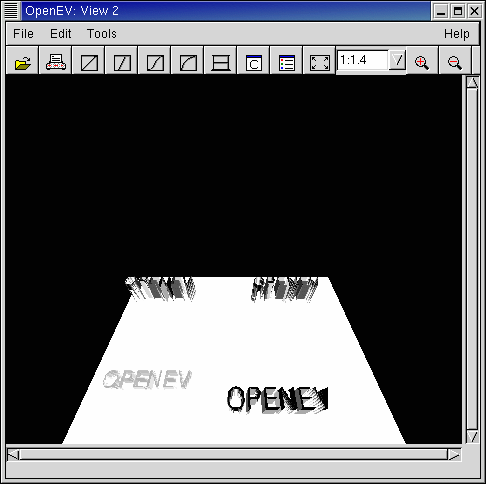
This dialog will allow you to print what you see in OpenEV's view area directly to a printer or to file.
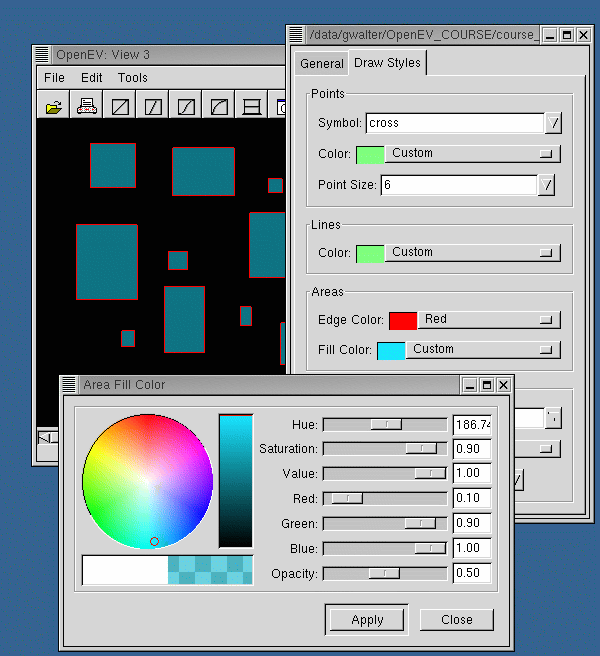
to bring up the classification dialog
for vector layers, and apply one of the ramps. This should colour the polygons according
to their class. If a vector file has several attribute fields, the menu bar in the
top right corner of the dialog will allow you to choose which one the classification
should use to distinguish between polygons.

Vector files containing point and line objects can also be manipulated through their vector property dialogs and the classification tool.
- File->Import: This asks for a (raster) filename, then converts the raster to GeoTiff format and creates tiled overviews for it. The new raster is saved to a file with extension ".tif".
- File->Save Project (only in some OpenEV distributions): This saves the current
openev state (number of views, what is loaded in
them) to an xml file. For instance, if you start OpenEV, load up "DEVCOURSE_greyscale_raster.tif", and
then save the project to projectfile_example.opf (.opf = Openev Project File), it will
contain:
<GViewApp>
  <GvViewWindow module="gvviewwindow" width="620" height="680" x="46" y="94">
    <title> View 1</title>
    <GvViewArea Mode="0" Raw="0">
      <Translation x="-256.0" y="-256.0"/>
      <Zoom> 0.211888298392</Zoom>
      <Background red="0.0" green="0.0" blue="0.0" alpha="1.0"/>
      <Layers>
        <GvRasterLayer mode="1" mesh_lod="7.162109375" visible="1" read_only="0" name="/data/openev/html/DEVCOURSE_greyscale_raster.tif">
          <Prototype band="1">/data/openev/html/DEVCOURSE_greyscale_raster.tif</Prototype>
          <Source index="0" min="0.0" max="255.0" nodata="-100000000.0" band="1">/data/openev/html/DEVCOURSE_greyscale_raster.tif</Source>
        </GvRasterLayer>
      </Layers>
    </GvViewArea>
  </GvViewWindow>
</GViewApp>
This file indicates that there is one view, with title "View 1", of width 620 and height 680 pixels. The view area is translated -256 pixels in both x and y directions and has a zoom level 0.211888298392. The background is black, and the view area contains a single raster layer, DEVCOURSE_greyscale_raster.tif. When "projectfile_example.opf" is loaded up in openev, the views present when the project file was saved (in this case, "View 1" with DEVCOURSE_greyscale_raster.tif in it) will be recreated, and all other views closed. "Save Project" uses the "serialize" functions found in gviewapp.py, gvviewwindow.py, and others to create a list of the items to include in the project file, and uses gdal.SerializeXMLTree to convert this list to XML text for writing to a file. GvViewWindowFromXML in gvviewwindow.py recreates a view based on the values saved in the project file. - Edit->Undo: Undoes the last editing operation performed on a vector layer.
- Edit->Go To: Translate the view to center on the location entered in the Go To dialog.
- Edit->3D Position: Translate the 3D position to the location and orientation entered in the 3D Position dialog.
- Edit->Preferences: Allows the user to set various preferences. See the Preferences section of OpenEV's help for more.