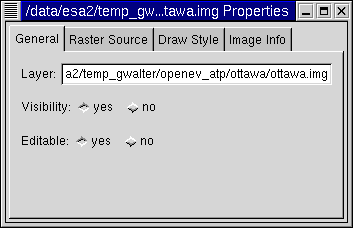
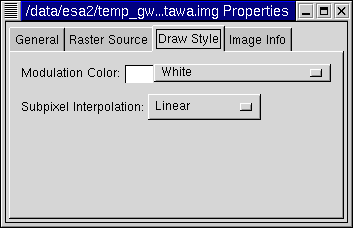
Setting the opacity of the modulation color (via the custom... entry) effectivly sets the opacity (alpha) for the whole layer. Alpha blending can also be achieved using the Alpha band of RGB layers on the Raster Sources tab.
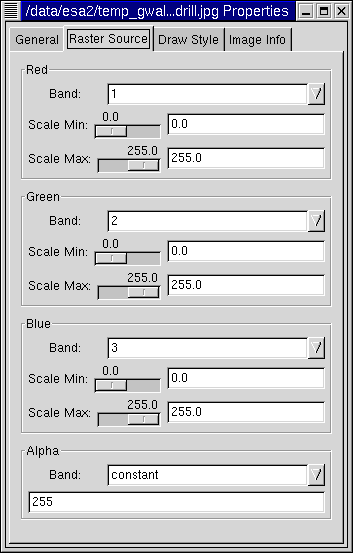
The Raster Sources tab allows control of the input raster bands used to generate the display layer. Each input component can be independently scaled, band mappings can be changed, and components can be set to use fixed scales instead of source bands.
Band: Select the band to use for this component from the file for this layer. At this time it is not possible to alter the source file after creation of the raster layer. If the value constant is selected instead of a band number, the scaling min/max controls will be replaced with an entry control which can be used to enter a single fixed value to use for that component for the entire layer.
Non-eight bit data (16bit integer, and floating point) is scaled to eight bit (range 0-255) before compositing, or putting through the layer lookup table. The scale minimum is mapped to 0, and the scale maximum to 255. The default scaling values are selected based on a 2% tail trim of a histogram of 10000 sample pixels from the image. Values outside the initial min/max range may be selected by typing them into text entry control.
Scale Min: Set the minimum value for scaling to eight bit.
Scale Max: Set the maximum value for scaling to eight bit.
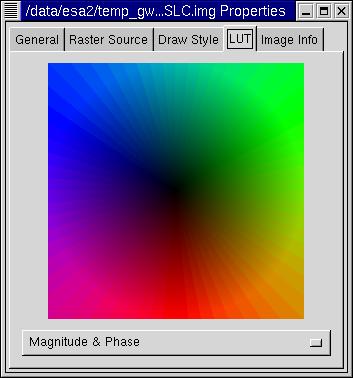
The LUT tab only appears for complex raster layers, and allows five options for how the 2D (real and imaginary) components of the complex data will be mapped into a color for display. The options are:
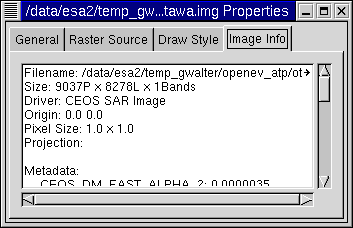
The Image Info tab displays additional information about the image, including any metadata stored within the file.